

Free Desktop-Certified-Associate Exam Files Downloaded Instantly 100% Dumps & Practice Exam
Free Exam Updates Desktop-Certified-Associate dumps with test Engine Practice
NEW QUESTION 31
Which of the following are valid calculations?
- A. SUM([Profit]) * 1000
- B. MAX(SUM(Profit), (Sales))
- C. SUM([Profit]) * SUM([Quantity])
- D. SUM([Profit]) * [Quantity]
Answer: A,C
Explanation:
You cannot mix the aggregated and non-aggregated calculations.
MAX(SUM(Profit), (Sales)) -> Profit is aggregated but Sales is not.
SUM([Profit]) * [Quantity] -> Profit is aggregated but Quantity is not.
You can multiply the aggregated/non-aggregated fields with constant. That's why SUM([Profit]) * 1000, is correct.
SUM([Profit]) * SUM([Quantity]) - Both are aggregated
NEW QUESTION 32
__________ function rounds a number to the nearest integer of equal or lesser value.
- A. FLOOR
- B. ROUND
- C. CEILING
- D. BUFFER
Answer: A
Explanation:
Explanation
NEW QUESTION 33
Connect to the "Significant Volcano Eruption" data source. How many volcano eruptions took place within 30 miles of the Black Peak volcano in the Alaska Peninsula?
- A. 0
- B. 1
- C. 2
- D. 3
Answer: A
Explanation:
Add the Latitude to Rows and Longitude to columns. Or double click on these fields.
Don't use Latitude (generated)/Longitude (generated) fields.
Drop Location to filter and select 'Alaska Peninsula'
Drop Name to the Label Marks card.
Your view will look like this:
Map Description automatically generated
Use the radial selection tool to find the number of volcano eruptions that took place within 30 miles of the Black Peak volcano. You need to zoom-in first, only then you would be able to find the distance using a radial selection tool.
A picture containing chart Description automatically generated
There were no eruptions that took place with 30 miles of Black Peak.
NEW QUESTION 34
Connect to the "Covid data" source. Create a line chart using continuous months and new deaths. Find the Excess Kurtosis for the sum of new deaths.
- A. -0.67
- B. -0.56
- C. -0.69
- D. -0.58
Answer: A
Explanation:
Drop the Date to the columns and select the continuous month. Drop New Deaths to rows.
Click on the Show/Hide card and enable the Summary Card.
Chart, line chart Description automatically generated
You will see the Summary Card on the right, if Excess Kurtosis is not enabled, click on the drop-down and select the Excess Kurtosis.
Graphical user interface, application Description automatically generated
NEW QUESTION 35
Tableau automatically associates continuous fields with categorical palettes.
- A. False
- B. True
Answer: A
Explanation:
Tableau automatically associates discrete fields with categorical palettes Refer: https://help.tableau.com/current/pro/desktop/en-us/visual_best_practices.htm
NEW QUESTION 36
Using the Sales Analysis Dashboard, create a filter action that will trigger once you select any state in Sales by State View, and it should update the Profit Vs Sales view. Find out using trend lines in the Profit Vs Sales view, how much does profit increase for each dollar of sales for the California state?
- A. 0.180067
- B. 0.294316
- C. 0.167531
- D. 0.133134
Answer: D
Explanation:
Go to the Dashboard menu -> Actions -> Add Action -> Filter
Configure the properties as:
Graphical user interface Description automatically generated
Ensure that West Region should be selected in the Region filter.
The final view should be:
Map Description automatically generated
profit increase by 0.133134 for each dollar of sales for the California state
NEW QUESTION 37
Connect to the "Global Superstore" data source and use the Orders table. Find out the average quantity ordered by customers whose first name starts with an 'S' alphabet?
- A. 4.02
- B. 3.39
- C. 3.56
- D. 3.43
Answer: C
Explanation:
Create a Calculation to get the first alphabet of the customer name.
Graphical user interface, text, application Description automatically generated
Now drop the First Alphabet field to Rows and Quantity field to the Text on the Marks card. Change the aggregation from SUM to AVG. Your view will look like this:
NEW QUESTION 38
How to create custom territories on a map?
- A. By using a background image on a map
- B. Geocode a territory field using another geographic field
- C. Select and group locations on a map
- D. Create a territory from a geographic field
Answer: B,C,D
Explanation:
Refer: https://help.tableau.com/current/pro/desktop/en-us/maps_custom_territories.htm
NEW QUESTION 39
Using the Profit Analysis Dashboard twbx file, find out the profit recorded in October 2016 by California State in the West region? You can add the functionality to the dashboard.
- A. $987
- B. $517
- C. $3,251
- D. $3,448
Answer: B
Explanation:
Select California State from the Map
NEW QUESTION 40
Connect to the "Global Superstore" data source and use the Orders table. Find out the group of states(in the US) having the highest sales in 2013?
- A. North Carolina, South Carolina, Virginia
- B. Texas, New Mexico, Colorado
- C. New York, Massachusetts, Rhode Island
- D. California, Idaho, Nevada
Answer: D
Explanation:
Drop the State field to a view, you will get >1k unknown.
Drop the Country to the Filters Shelf and Select the United States, all unknowns should be gone.
Also, drop the Order Date to the Filters Shelf and choose Years as:
Graphical user interface, application Description automatically generated
Check for the Year 2013.
Drop the Sales field to the Label in the Marks card, your view should look like this:
Graphical user interface Description automatically generated with medium confidence
Now use the Lasso Selection tool from the Map tools:
Graphical user interface, diagram Description automatically generated
And create the group of states as per our answer options.
Example - for New York, Massachusetts, Rhode Island, Similarly, do for other 3 options as well.
Map Description automatically generated
Duplicate this worksheet and remove the Latitude and Longitude from the view and drop this new dimension of groups to the view. California, Idaho, Nevada is the right answer.
Graphical user interface, text, application Description automatically generated
NEW QUESTION 41
Connect to the "Global Superstore" data source and use the Orders table. Predict the profit of January 2016 using the profit data through December 2015. What is the profit value of January 2016?
- A. $35,152
- B. $46,917
- C. $33,759
- D. $39,921
Answer: A
Explanation:
Drop the Orders Date to the Columns shelf and change it to the Month Date Value and drop the profit to the rows shelf. Your view will look like this:
Graphical user interface, text, application Description automatically generated
Go to the Analytics tab and drop the Forecast to your view.
Right-Click on the view, Select Forecast -> Forecast Options. Change the Ignore last to 0 months, Graphical user interface, text, application Description automatically generated
$35,152 is the correct answer.
Graphical user interface, chart, line chart Description automatically generated
NEW QUESTION 42
Connect to the "Kiva Loans - India" data source, which sector's funded amount is closest to the median of all the sectors?
- A. Clothing
- B. Construction
- C. Retail
- D. Education
Answer: A
Explanation:
Drop Sector to columns and Funded Amount to Rows.
From Analytics, drop the Median with Quartiles to your view or drop the reference line, select the Median.
Your view will look like this:
Chart, bar chart Description automatically generated
Here, the Clothing funded amount is exactly similar to the Median.
NEW QUESTION 43
In your view, you are using a background image. How can you find the X and Y coordinates on your image?
- A. Using drop lines
- B. By annotate a point
- C. Using custom geocoding
- D. By annotate an area
Answer: B
Explanation:
Explanation
https://help.tableau.com/current/pro/desktop/enus/
bkimages_coordinates.htm#:~:text=Right%2Dclick%20anywhere%20on%20the,Annotation
%20dialog%20box%2C%20click%20OK.
NEW QUESTION 44
Connect to the "Global Superstore" data source and use the Orders table. Find out the percentage of total sales in all the categories in 2015 by customers who have purchased any product in the Phones sub-category in
2014? Use Customer ID.
- A. 5.03%
- B. 4.90%
- C. 4.53%
- D. 3.45%
Answer: D
Explanation:
Explanation
Approach 1 - Using Groups
Drop the Customer ID to the Rows.
Add sub-category to the filter and select phone.
Add Order date to the filter and select the year 2014.
Select all the customers and click on paper clip icon to create the group.
So here we got all the customers who have purchased any product in the Phones subcategory in 2014.
Edit the group and select Include other
Clear the filter shelf, and again add Order date to the filter and select 2015.
Drop Sales to the Text.
Add 'Percent of Total' Quick Table Calculation to the Sales field.
Your view will look like this: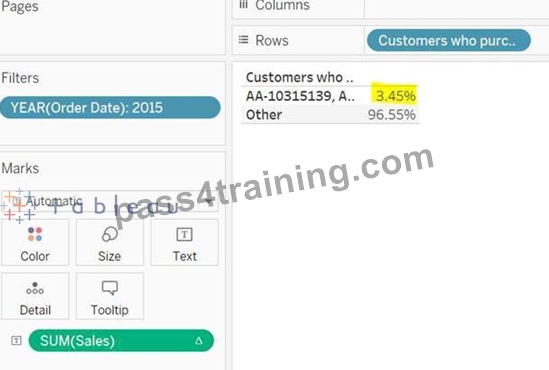
Approach 2 - Using LOD
Create a LOD expressions as:
It will return 1 for the customers who have purchased any product in the Phones sub-category in 2014. For others, it will return 0.
Drop this field to the Rows and add Order date to the filter and select the year 2015.
NEW QUESTION 45
Connect to the "Covid data" source. What is the percentage increase in the new cases from July 2020 to Jan
2021?
- A. 98%
- B. 125%
- C. 113.50%
- D. 118.50%
Answer: C
Explanation:
Create a filter on date field and select only July 2020 and Jan 2021.
Graphical user interface, application Description automatically generated
Drop Date Month Discrete to Columns and New cases to the Text.
Right-Click on New Cases field and Quick Table Calc ->Percent Difference Graphical user interface, application Description automatically generated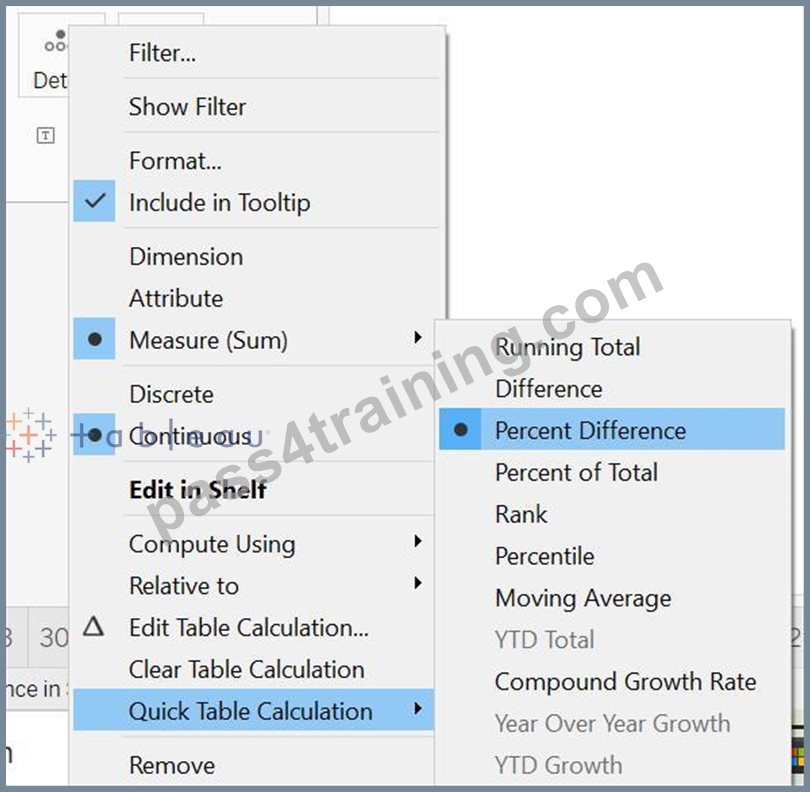
Graphical user interface, text, application, chat or text message Description automatically generated
NEW QUESTION 46
When we blend the data, sometimes a Null value appears in place of data. What could be the possible reasons for the same?
- A. The values in the primary and secondary data sources use different casing.
- B. The data types of the fields you are blending on are different.
- C. The secondary data source does not contain values for the corresponding values in the primary data source.
- D. The data to combine is at different level of detail.
Answer: A,B,C
Explanation:
Explanation
Refer section "Null values appear after blending data sources" at
https://help.tableau.com/current/pro/desktop/enus/
multipleconnections_troubleshooting.htm
NEW QUESTION 47
You are unable to join two tables because tableau throws the type mismatch error. How you can solve it most likely?
- A. Using cross-database join
- B. Using Blend
- C. Using Join Calculations
- D. Using Union
Answer: C
Explanation:
Explanation
Use join Calculations while joining two tables.
NEW QUESTION 48
......
Provide Valid Dumps To Help You Prepare For Tableau Desktop Certified Associate Exam Exam: https://www.pass4training.com/Desktop-Certified-Associate-pass-exam-training.html
